
The State of Care in Surrey
Surrey is home to a growing number of older adults, many of whom are living independently, supported by family, or beginning to need more regular care. This page brings together the key local figures to help make sense of the care landscape, from ageing and dementia to unpaid carers, provider quality, and service availability, so families can better understand what support might look like now and in the years ahead.
What this page covers
- How Surrey compares with England on ageing and household profile
- What the figures show about people living alone and family responsibility
- How many people are providing unpaid care and how many are under strain
- Where dementia sits in the local care picture
- How much choice exists across home care and care homes
- Why provider quality matters when families are trying to decide what to do next
Surrey at a glance
Surrey is home to 1,203,111 people. Within that total, 227,193 people are aged 65 or over, which means older adults account for 18.9% of the county's population. Residents aged 85 and over represent 3.0% of the population. Both figures sit above the England averages of 18.4% and 2.4%, making Surrey one of the more significantly aged counties in the country.
That older-than-average profile brings real care implications. A large number of older people are living alone, thousands of relatives are providing unpaid care, and demand grows steadily as health, mobility, or memory begin to change. Surrey also has a high client satisfaction rate of 97.3% among home care users, pointing to strong quality expectations from families in the area.
Age profile and living situation
Surrey's age profile sits above the England average, meaning the county faces care pressures that are above the national norm. The chart below brings together the county's total population, the size of its older population, and the significant share of residents aged 85 and over who are most likely to need regular support.
of older adults in Surrey prefer to remain in their own home. That figure shapes everything about local care demand, from home care availability to the role of unpaid family carers.
What stands out first
Surrey is older than England overall, and that matters. 227,193 people aged 65+ is a substantial figure, and a higher proportion of those residents are in the oldest age groups where care needs are most complex.
The oldest age group still matters
Surrey's 85+ population at 3.0% of residents is meaningfully above the England average of 2.4%. This is often the age group most likely to need help with personal care, mobility, frailty, falls, or multiple health conditions.
Home preference shapes demand
With 74% of older adults preferring to remain at home, the pressure on home care services in Surrey is significant. That preference is real and consistent, and it shapes what families are looking for when they begin exploring support options.
How Surrey compares with the rest of England
Surrey's age profile sits above the national average. People aged 65 and over make up 18.9% of Surrey residents, compared with 18.4% across England. For people aged 85 and over, the local figure is 3.0% compared with 2.4% nationally. These are not small gaps. They reflect a county where older residents make up a larger share of the total population, and where the proportion in the oldest, highest-need age group is notably higher.
Unpaid carers represent 7.5% of Surrey's population, slightly below the England average of 8.9%, which may reflect the county's higher rate of formal care provision rather than lower underlying need.
The role of unpaid carers in Surrey
Unpaid carers remain one of the most important parts of the local care picture. Surrey has 90,497 unpaid carers, equal to 7.5% of the population. The figure is slightly below the England average of 8.9%, but it still represents tens of thousands of people supporting a partner, parent, sibling, or relative in everyday life.
Within that group, 25.9% are providing 50 or more hours of care each week. That is a very high level of responsibility. It often affects work, sleep, social life, and the ability to keep going over time. With Surrey's older population sitting above the national average, the underlying pressure on those carers is likely to be sustained.
For many families, paid care does not replace family involvement. It supports it. That matters because the pressure usually builds gradually, not all at once.
Unpaid care at a glance
61% of home care hours in Surrey are publicly funded
That figure reflects the scale of local authority commissioning in Surrey and the degree to which formal care is already embedded in many households alongside or instead of family-provided support.
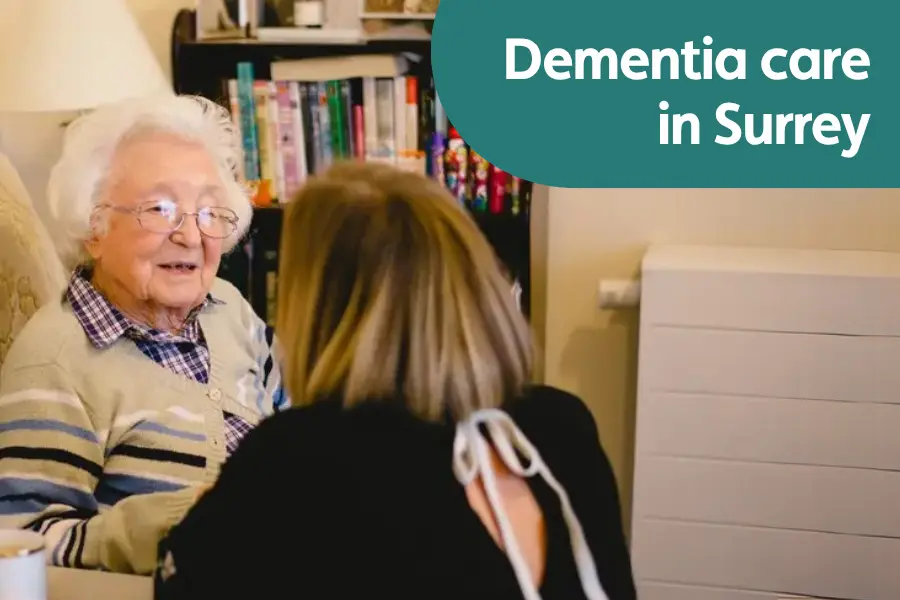
Dementia remains a major part of local care need
The dementia landscape in Surrey is one of the clearest pressures within the region. The recorded diagnosis rate for people aged 65 and over is 67.5%. That means only around two thirds of the expected dementia population is represented in the recorded diagnosis figure.
Put another way, 32.5% of the expected dementia population may still sit outside the formal diagnosis figure. For a county with 227,193 residents aged 65 and over, that gap translates to a meaningful number of people who may be living with undiagnosed dementia without the support that a diagnosis can unlock.
For families, this matters enormously. It often means they are seeing memory loss, confusion, repetition, changes in mood, or reduced safety at home before they fully understand what is happening. Support can be delayed simply because the picture is not yet clear.
Dementia figures in Surrey
Diagnosis rate
People aged 65+ with a recorded dementia diagnosis
Likely diagnosis gap
The share that may still sit outside the diagnosis figure
A diagnosis gap does not just affect statistics. It affects timing. Families may delay bringing in support because they are still trying to work out whether what they are seeing is forgetfulness, frailty, illness, or dementia.
Care demand and home care provision
Surrey has 291 CQC-registered home care providers, which represents a well-developed local market for a county of its size. With 227,193 residents aged 65 and over, 90,497 unpaid carers, and a strong preference among older people to remain at home, the demand placed on that network of providers is real and growing.
Sixty-one percent of home care hours delivered in Surrey are publicly funded, which signals a significant commissioning infrastructure alongside private care arrangements. Families looking for support are entering a market with real breadth, but where quality still varies and the highest standards remain rare.
What these figures tell us
- 291 registered providers gives Surrey one of the broader home care markets in the South East
- 91% rated Good or Outstanding reflects a high-performing market by national standards
- 61% publicly funded hours suggests significant local authority activity alongside private commissioning
- 97.3% client satisfaction shows that where quality is high, families notice and value it
For families, these figures often mean choice exists, but good choice still needs careful filtering. Availability alone is not the same as confidence.
Home care quality in Surrey
Surrey has 291 registered home care providers, and 91% of those with published CQC ratings have been rated Good or Outstanding. That is a strong overall picture compared with many other counties. But it also means that around one in ten providers has not reached that threshold, and families still need to look carefully at which individual providers they choose.
The national Outstanding rate for home care providers stands at approximately 2.8%. Even in a well-performing county like Surrey, Outstanding-rated providers represent a very small share of the overall market. That rarity matters. It is the difference between a provider that meets expectations and one that consistently exceeds them.
That is exactly why families often need more than a simple provider list. They need a clearer sense of consistency, management, communication, and how well support is overseen day to day.
Why those ratings matter
When only a small number of providers achieve the highest rating, families need to look beyond basic availability. The more useful questions become whether caregivers are well matched, whether visits are consistent, whether the service is managed properly, and whether support adapts when needs change.
Unique Senior Care holds a CQC Outstanding rating in Surrey.
In a local market where Outstanding-rated home care providers represent a very small share of the total, that rating places the service among a rare group of providers who have consistently met the highest inspection standard.
97.3% client satisfaction across Surrey.
That figure comes from verified reviews on homecare.co.uk. It reflects consistency in delivery and the kind of day-to-day reliability that families are looking for when they place trust in a provider.
What this means for families in Surrey
Surrey is older than England overall, with a higher share of residents in the 65+ and 85+ age groups. That is not a statistical curiosity. It translates directly into more families managing care decisions, more older people living alone or with a partner who is also ageing, and more unpaid carers taking on responsibilities that stretch over months and years.
Dementia remains a significant local issue, with a diagnosis gap that means some families are managing difficult changes without a confirmed explanation and without the right support in place early enough.
The county offers a broad home care market with a high proportion of providers rated Good or Outstanding, and a client satisfaction rate of 97.3%. But the very highest quality remains rare. For families, that makes careful comparison essential, not just looking at who is available, but understanding who is consistently good.
In practical terms, the Surrey care picture suggests that many families benefit from planning earlier, asking better questions, and comparing providers carefully rather than waiting until a hospital stay, fall, diagnosis, or sudden decline forces a rushed decision.
Related Surrey pages
|
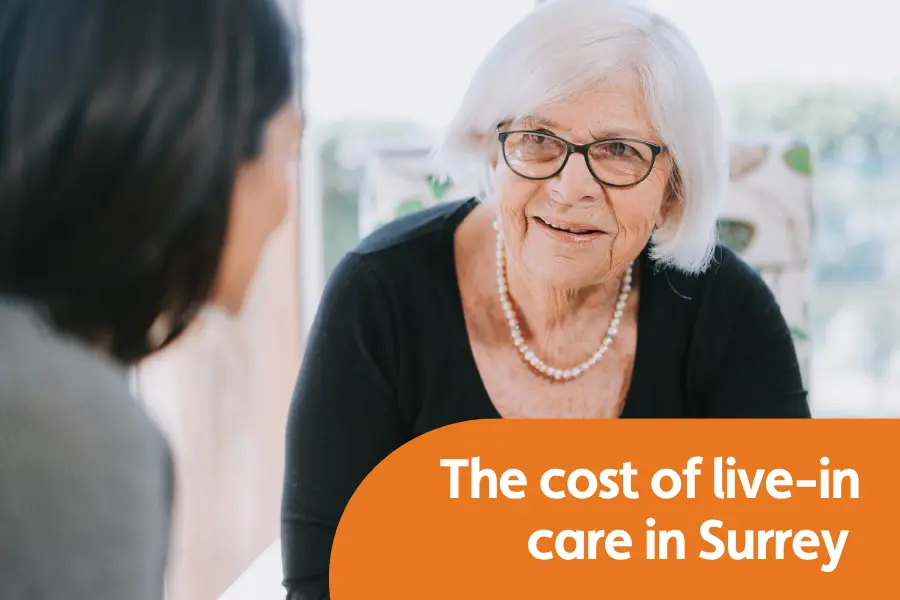
Surrey live-in care
|
Surrey dementia care
|
|
Surrey live-in care costs
|
Surrey live-in care providers compared
|


Page written by:
With over 40 years of experience in the care industry, providing outstanding care has always been Helena’s core mission.
Helena has been a dedicated member of Unique Senior Care for eight years, starting as Care Manager and advancing to Head of Extra Care and now serving as Director of Operations.
She holds a Level 5 Diploma in Leadership for Health and Social Care and Children and Young People’s Services (England), as well as a Diploma in Welfare Services. Helena has completed various leadership and management courses, enhancing her expertise in the care industry.
Helena has authored published articles, including one for Skills for Care on managing change through the COVID pandemic. She has a steadfast commitment to advocating for and supporting those in need, ensuring their voices are heard and their rights upheld.